Massachusetts General Hospital (MGH) investigators have developed a novel approach to analyze brainwaves during sleep, which promises to give a more detailed and accurate depiction of neurophysiological changes than provided by a traditional sleep study. In a report published in the January issue of Physiology, the research team describes how applying a technique called multitaper spectral analysis to electroencephalogram (EEG) data provides objective, high-resolution depictions of brainwave activity during sleep that are more informative and easier to characterize than previous approaches. The researchers also present a visual atlas of brain activity during sleep in healthy individuals, highlighting new features of the sleep EEG — including a predictor of REM sleep — that could be of important use to clinicians and researchers.
“During sleep, the brain is engaged in a symphony of activity involving the dynamic interplay of different cortical and sub-cortical networks,” says Michael Prerau, PhD, of the MGH Department of Anesthesia, Critical Care and Pain Management, lead author of the Physiology report. “Due to practical constraints and established practices, current clinical techniques greatly simplify the way the sleep is described, causing massive amounts of information to be lost. We therefore wanted to identify a more comprehensive way of characterizing brain activity during sleep that was easy to understand and quick to learn, yet mathematically principled and robust.”
The approach used by the MGH investigators provides a paradigm shift allowing clinicians to move away from subjective sleep staging and harness the wealth of objective information contained within EEG data. In their report, the team describes how sleep oscillations are far more easily characterized using spectral estimation than by looking at EEG traces. Spectral analysis is a class of approaches that break a waveform signal into its component oscillations — repeating patterns over time- just as a prism breaks white light into its component colors. In the EEG, these oscillations represent the activity of specific brain networks during sleep and wakefulness.
“At a fundamental level, brain activity is truly organized in terms of oscillations and waves,” says senior author Patrick Purdon, PhD, MGH Anesthesia. “Spectral analysis is just analyzing the signals in terms of these waves, making it the right tool — and in some ways the perfect tool — for the job.” Purdon also points out that traditional sleep scoring is essentially a crude form of spectral analysis, based on recognizing the wave properties by eye.
Spectral analysis may not have been adopted for sleep scoring previously because the prevailing techniques for EEG spectral estimation produced noisy and inaccurate estimates of the power spectrum, making interpretation of the resulting spectrogram difficult. Consequently, the MGH team employed multitaper spectral analysis, a form with greatly reduced noise and increased accuracy compared to more basic methods. Computing a multitaper spectrogram of the sleep EEG, which tracks how the power and frequency of these oscillations change over time, provides more information about which networks are active at different points during sleep.
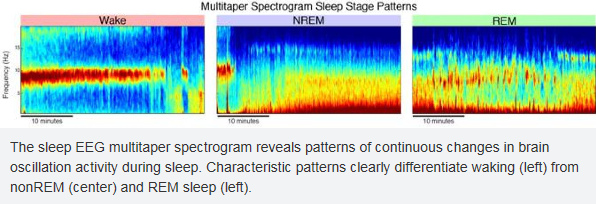
In their report the researchers use these new vivid images of brain activity to illustrate how the sleep EEG multitaper spectrogram objectively reveals the detailed architecture of an entire night of sleep in a single visualization, rather than 1,000 30-second windows. Repeating patterns of activity — which use color to reflect signal power — become apparent even to the untrained eye, allowing technicians with only a few hours of training to stage with an accuracy comparable to that of traditional sleep scoring.
Journal article:
http://physiologyonline.physiology.org/content/32/1/60
Source:
http://www.massgeneral.org/about/pressrelease.aspx?id=2055

Leave a comment